

Document Analysis
Graphs and charts are a compact visual representation of data, results and conclusions of research and form a key component of the published literature. Graphs and scientific plots are mostly ignored by most popular search engines and have only received moderated attention in the recent years with lack of working applications that can extract relevant information from them in a fully automated manner. Under this grant, we have tackled this problem via two approaches 'top-down' (processing of charts in general by understanding common sub-elements of graphs like text, legend axis) and 'bottom-up' (processing of specialized domain-specific charts like phase diagrams). Apart from scientific charts, we also focus on other non-traditional sources of information such as lecture and presentation videos where we attempt to extract text, mathematical expressions and figures from slides or whiteboard content within the video to empower downstream recognition and search applications.
Competition on Chart Data Extraction

The 2019 competition on chart data extraction has concluded. Visit here for details.
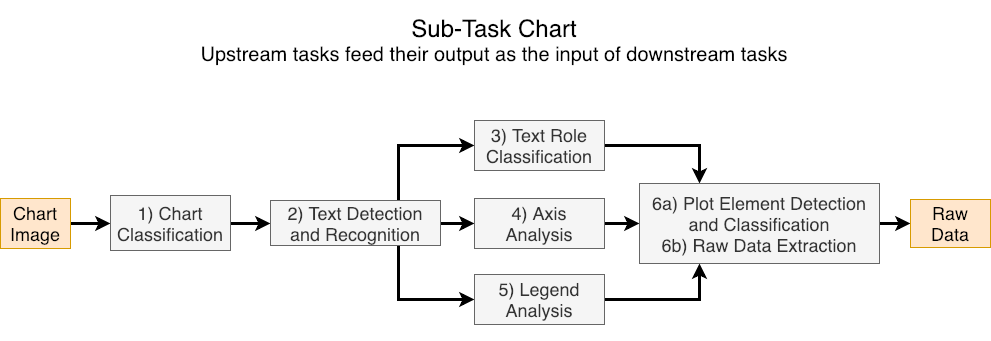
Automatically extracting data from charts is a key step in understanding the intent behind a chart which could lead to a better understanding of the document itself. We have organized a competition composed of a series of 6 sub-tasks for chart data extraction, which when put together as a pipeline go from an input chart image to a CSV file representing the data used to create the chart.
Domain-specific Chart Processing
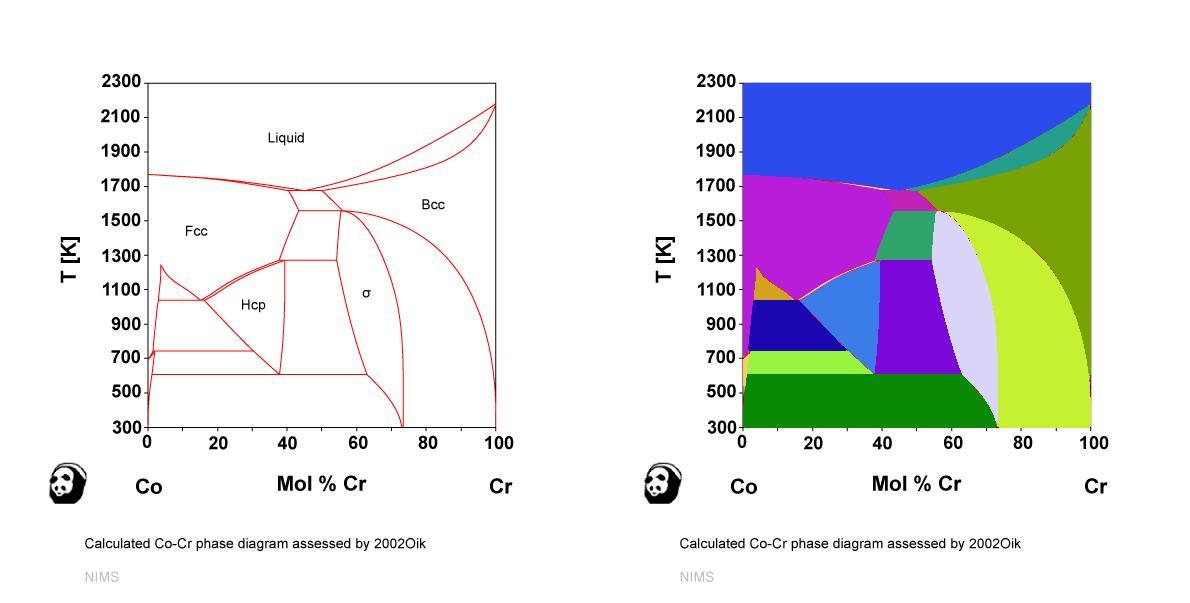
In this approach we used the known contextual knowledge to synthesis the information from the diagrams. Specialised rules may be required in such cases to interpret the diagrams. Phase Diagrams are an important type of diagrams in materials science literature. We laid the groundwork for a large-scale, indexable, digitized database of phase diagrams with different thermodynamic conditions and compositions for a wide variety of materials.
General Chart Processing
In the top-down approach, the system takes a set of documents as the input and outputs an index that stores the most relevant information extracted from those documents. Various steps need to be followed including segmenting out charts from multi-panel and multi-figure layouts, understanding chart type, and then finally extracting the data. We have found that there are few approaches that handle this end-to-end making it an exciting research problem.