

Competition on Chart Data Extraction
The 2019 competition on chart data extraction has concluded. Visit here for details.
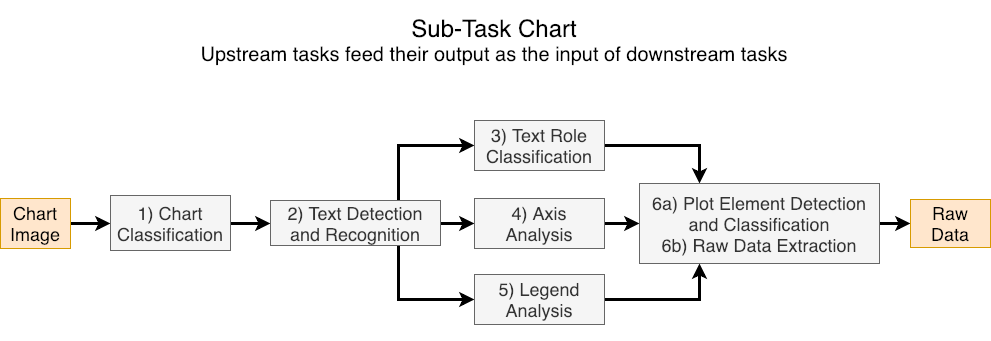
Automatically extracting data from charts is a key step in understanding the intent behind a chart which could lead to a better understanding of the document itself. We have organized a competition composed of a series of 6 sub-tasks for chart data extraction, which when put together as a pipeline go from an input chart image to a CSV file representing the data used to create the chart.
Charts are a compact method of displaying and comparing data. In scientific publications, charts and graphs are often used to to summarize results, comparison of methodologies, emphasize the reasoning behind key aspects of the scientific process, and justification of design choices, to name a few. Automatically extracting data from charts is a key step in understanding the intent behind a chart which could lead to a better understanding of the document itself. We have organized CHART-INFO: a Competition for HArversting Raw Tables from INFOgraphics. It is composed of a series of 6 sub-tasks for chart data extraction, which when put together as a pipeline go from an input chart image to a CSV file representing the data used to create the chart. Entrants in the competition may choose to participate in any number of sub-tasks, which are evaluated in isolation, such that solving previous sub-tasks is not necessary. We hope that such decomposition of the problem of chart data extraction will draw broad participation from the Document Analysis and Recognition (DAR) community. Additionally, we also evaluate methods that perform the whole chart data extraction pipeline from the chart image without receiving intermediate inputs. We have organized this conference in collaboration with Adobe Research and the results will be presented at ICDAR 2019. View Competition Website.