

General Chart Processing
In the top-down approach, the system takes a set of documents as the input and outputs an index that stores the most relevant information extracted from those documents. Various steps need to be followed including segmenting out charts from multi-panel and multi-figure layouts, understanding chart type, and then finally extracting the data. We have found that there are few approaches that handle this end-to-end making it an exciting research problem.
The process can be subdivided in multiple sub-steps including:
- High level metadata indexing
- Document analysis
- Figure extraction
- Multi-panel figure identification
- Multi-panel figure separation
- Figure classification
- Figure data extraction
The high level metadata indexing step is source dependent and attempts to extract relevant information describing the document itself at a general level including the original publication source (journal, volume, issue), title, year, etc. In the document analysis phase, the system will attempt to locate and isolate relevant elements that will be added to separated index including text, math expressions, tables, diagrams, plots and other elements of interest. This step is also source dependent, and becomes harder when the original documents are provided in self contained formats like PDF. In contrast, some publications are available in text-based formats like HTML or XML derivatives with references to external files representing figures or tables, thus making their extraction easier and more accurate.
For accuracy, the system determines the correct type of a graphic and then the appropriate data extraction process used to extract the relevant information from them. The extracted information can be made available for indexing and retrieval. Figure shows an example of a single Figure from a given paper that contains a mixture of two separated kinds of plots (a bar plot and a line plot). While both share some common elements like x and y axes with their corresponding captions, the final data extraction process needs to identify the subtype of each plot to correctly re-interpret the geometric information on the image as raw data points.

Fig.1. An example of a simple multi-panel figure containing both a bar plot and a line plot on the same figure.
Our tests show that it will be important to first establish a multi-panel classification and segmentation step as a required preprocessing step for figure classification. Multi-panel figures normally combine very different kinds of sub-figures that lead to confusion cases for the clustering-based classification approach. Figures 1 and 2 show examples of multi-panel figures. Very complex multi-panel figures like the one shown in Figure 2 cause degradation on our initial clustering model. Further processing is required to first separate these multi-panels into individual panels. The extracted panels along with their corresponding sub-portions can be treated as individual figures by the clustering algorithm, and we expect this to improve the quality of the final clusters.
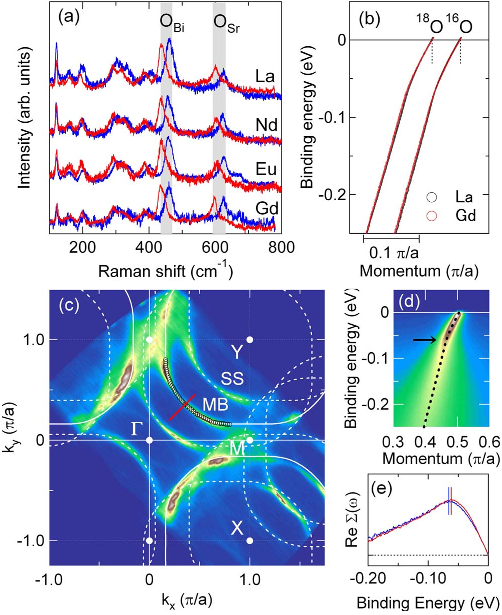
Fig.2. An example of a more complex multi-panel figure 5 types of graphics. A more complex, plot-aware segmentation procedure is required to split this image into its individual sub-figures.
Even if the correct type of given figure is determined precisely, some common extraction challenges remain to be solved for multiple plot types. In particular, for one of the most common plot types, the line plot, we have identified some challenges not yet addressed/solved by existing approaches shown in Figure 3. First, we have found cases where the axis have been used in non-standard ways including split/discontinuous axis values, and also shared axis like the example shown in Figure 3.a where the X-axis is shared by both individual plots. Second, dashed lines and cluttering still represents a major challenge to interpret data found in this kind of diagrams. Dashed lines are harder to map into single lines, and the task becomes harder even for contiguous lines when the same color is used for all lines and these occupy very similar values as the example shown in Figure 3.b. Finally, another relevant challenge found is the inclusion of sub-plots which might or might not be related to the current line plot. In many cases, authors try to emphasize or show a more precise version of a region of a plot by creating a zoomed-in version of a given region of the plot but displaying such region on the "free space" of the original plot, thus making the whole analysis of both plots more difficult. These are just some example of the challenges that are expected as the top-down approach gets closer to specific types and sub-types of figures. Different kinds of plots will pose additional challenges on their own.
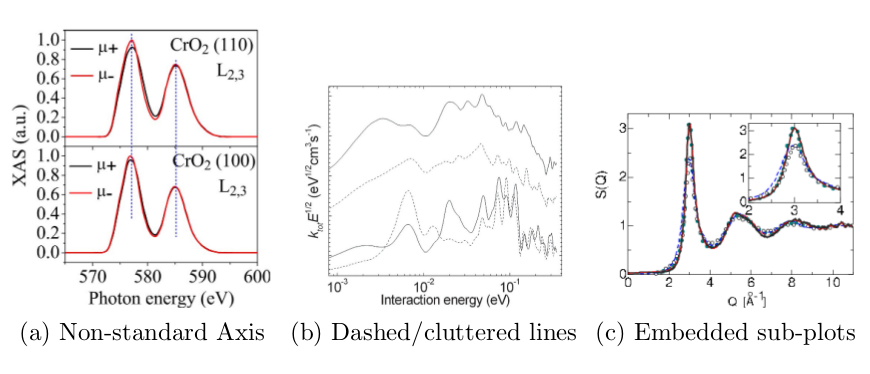
Fig.3. Examples of common challenges on data extraction from line Plots. (a) Non-standard ways to use axis. In this example, the same vertical line is shared by two plots by simply re-setting the scale, while the x-axis is only included in the lower plot but is used by both lines. (b) Dashed and/or cluttered lines. Here, the dashed lines become cluttered making them harder to separate. (c) Embedded sub-plots, where some authors try to emphasize sub-regions of the plot by using empty space to include zoomed versions of the same plot.
The current state of the top down approach includes an API for preprocessing of documents that handles the indexing of metadata and automatic extraction of figures. These tools and the tools used for our initial clustering experiments will be made available in the near future.
Finally, one of the main products of the top-down approach are
- Our survey on different approaches used for analysis of and data extraction from figures.
- Our competition on data extraction from charts including annotated chart images from synthetic and real sources, tools for evaluation and annotation.