

ML Toolkit Usage Guide
The Machine Learning Toolkit provides a graphical user interface (GUI) which bridges this gap for people with little to no coding skills. It is designed for the user to be able to quickly build machine learning models on the fly with a simple to use web based tool which uses drag-and-drop functionalities and harnesses the power of extremely sophisticated machine learning, deep learning, and computational software to provide the predicted results to the user. In this article, we briefly describe the GUI functionalities and usage guide.
Computational Graphs
Graphs are perhaps the most basic, simplest data structure that have a robust capacity to convey knowledge in diverse forms.
A computational graph is one where each node of the graph represents a certain mathematical computation being done on its inputs. each edge between the nodes can be used to describe the input/output data for the following step. It is a directed acyclic graph (DAG) and usually in practice starts with an data input source and after carrying out the described mathematical functions would terminate at an final output data, which we could save for further analysis in the future.
This data structure is perfect for describing the life-cycle of any machine learning model. Thus the main interface of our ML toolkit provides the user with an HTML canvas based draw area where building the model just requires drawing the nodes and connecting the edges.
Basic Layout and Functionality
The ML toolkit provides a collapsible menu (left side) with 3 primary options:
Home
The toolkit homepage provides a clear overview of the involved components and steps involved for the usage of the tool.

Dashboard
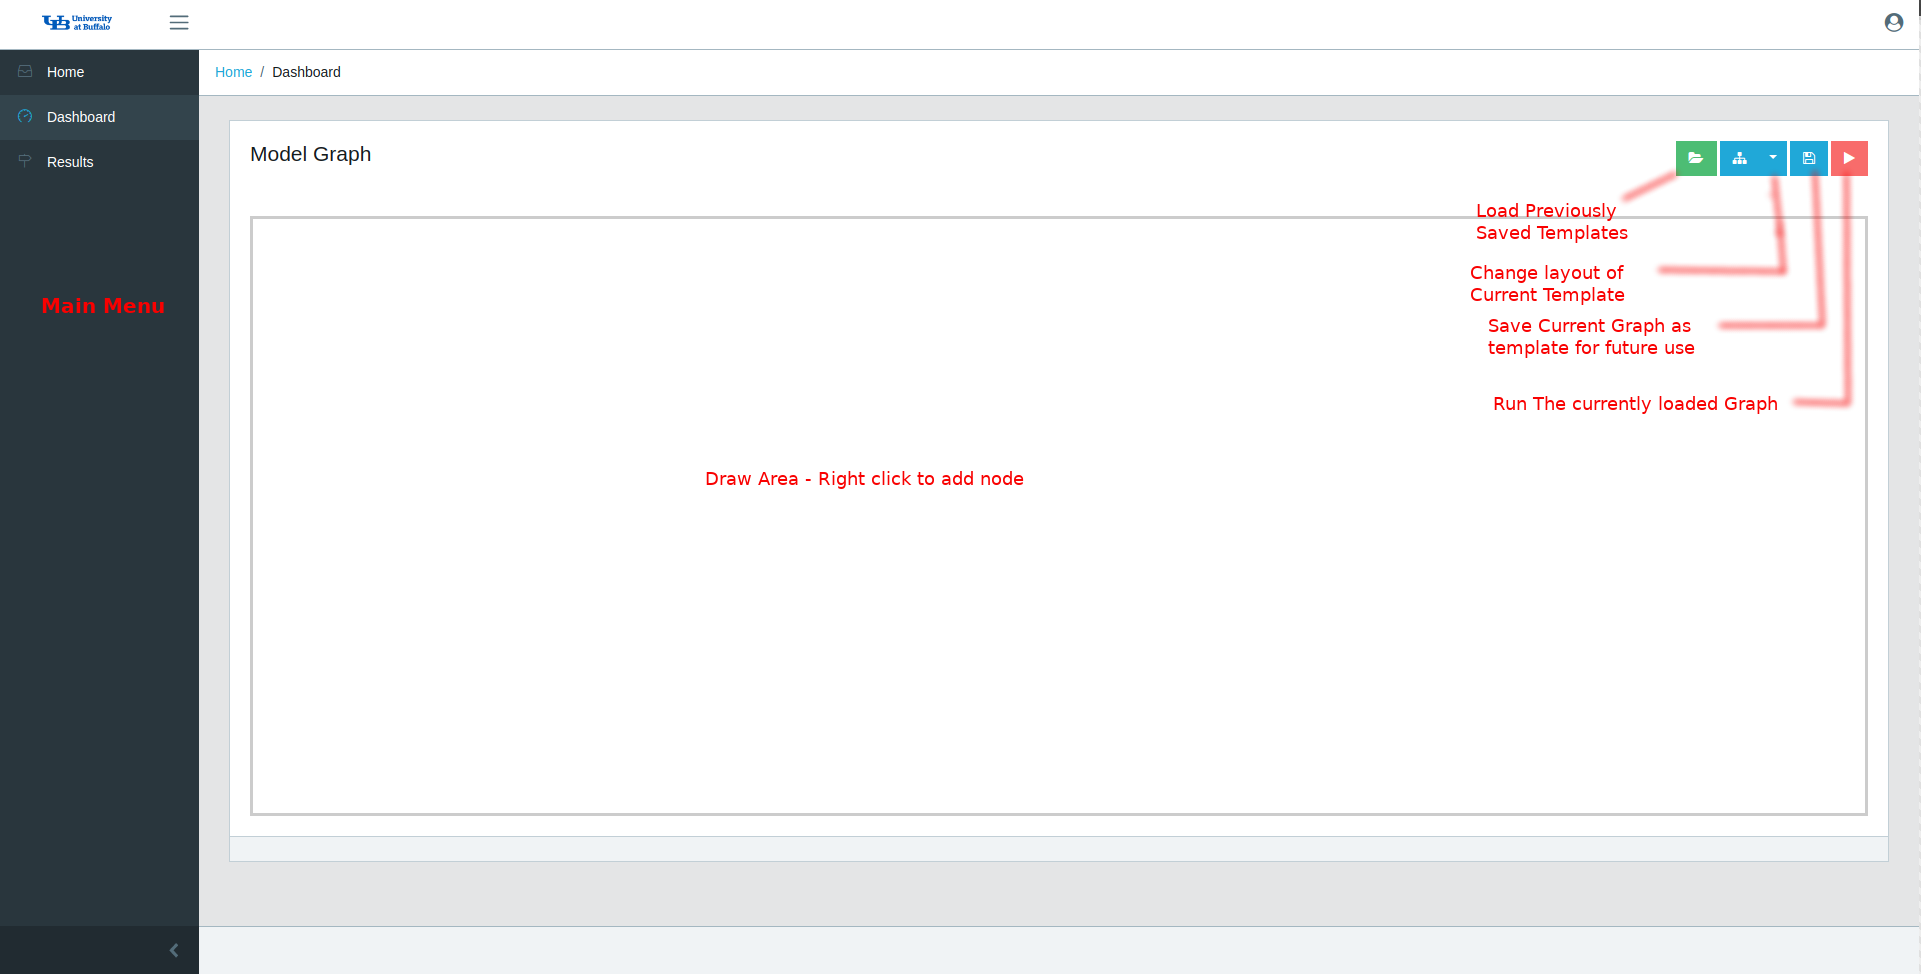
This is the main part of the application where the computational graphs are constructed. The central area is a large canvas to draw the computational graphs. One can start by just simply right clicking in the blank space to add nodes. There are 4 options provided in the top right corner:
- Load a template - To load a previously save graph template
- Change Layout - To change the visual layout of the current graph
- Save - Saves current draw area as a template
- Run - Attempt to run the current graph
Results
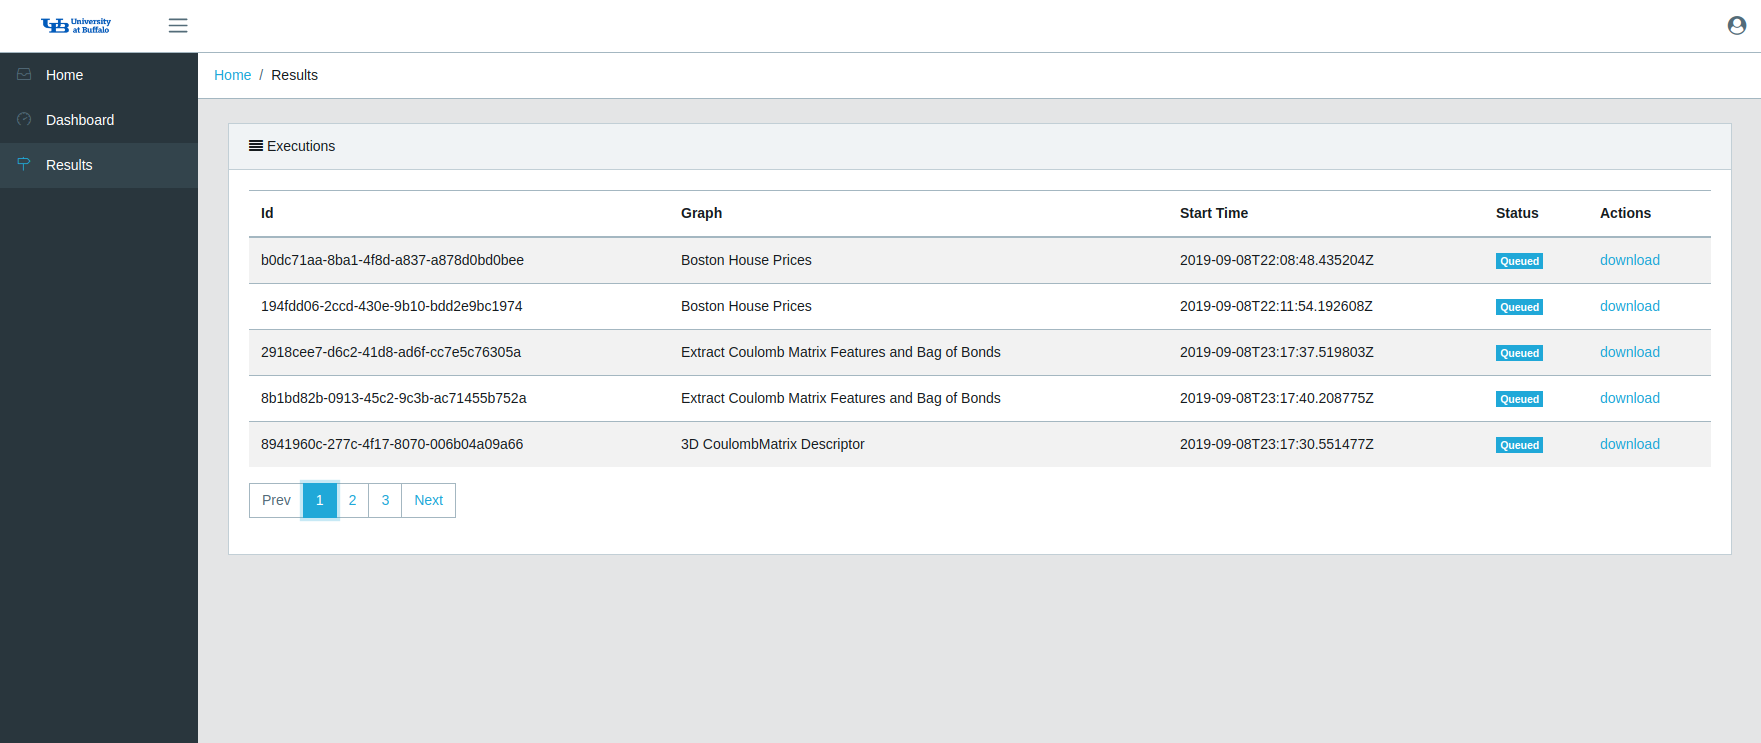
The results page shows the results of previous graph runs. The Machine Learning Toolkit employs a worker queue scheduler based system. This provides an effective way to run multiple graphs at the same time without blocking the graph run mechanism on a single task. Thus, users can potentially design different variants of the same model and run them in parallel instead of waiting on one model results.
As different algorithms and diverse data inputs can have very different running times the results pan shows the current status of the task - queued, successful, or failed. Once a task has run successfully the user can download any related output plots, loss data frames, or just csv of feature representations.
Building a Graph from Templates
The easiest way to start implementing machine learning models is to load and run one of the default provided templates. Templates are end-to-end computational graphs provided for certain common ML tasks such as Regression. It starts from data upload (or some of the preloaded sample datasets from chemical domains can be chosen) and ends with generating a plot comparing predicted and ground truth values. Templates can be modified by right clicking on a node/edge and changing parameters. New nodes and edges can also be added and modified templates can be stored for future use. The procedure to modify/add nodes/edges can be seen in following sections where we explain how to build a graph from scratch.
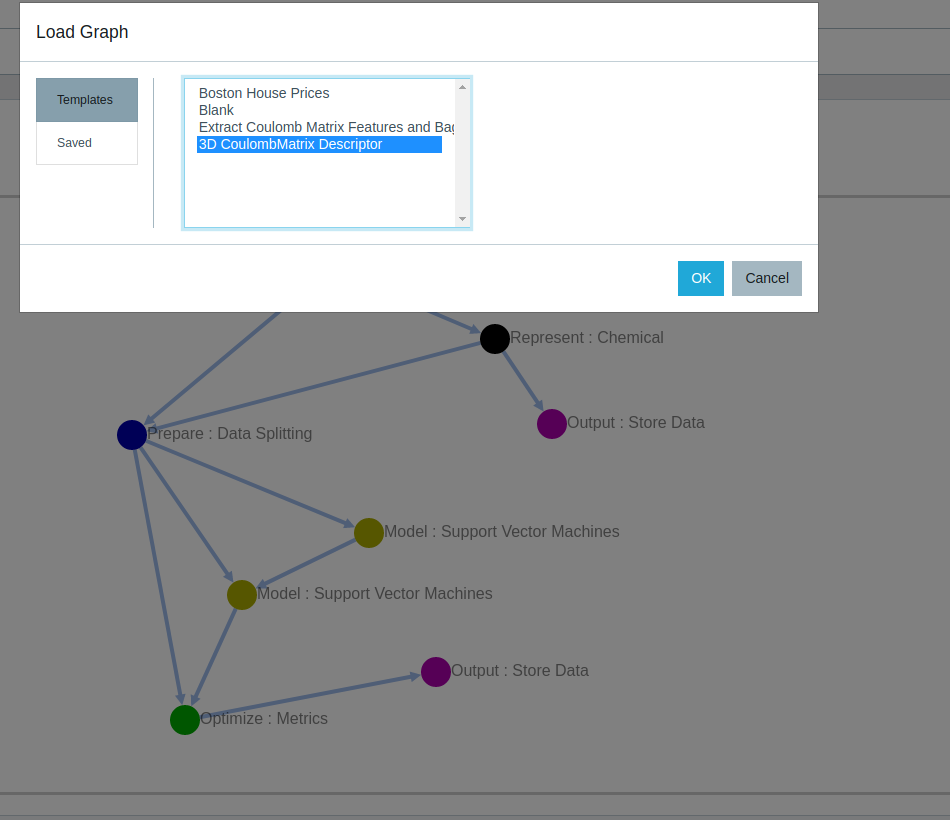
(a) Loading a template from the top-right of the dashboard
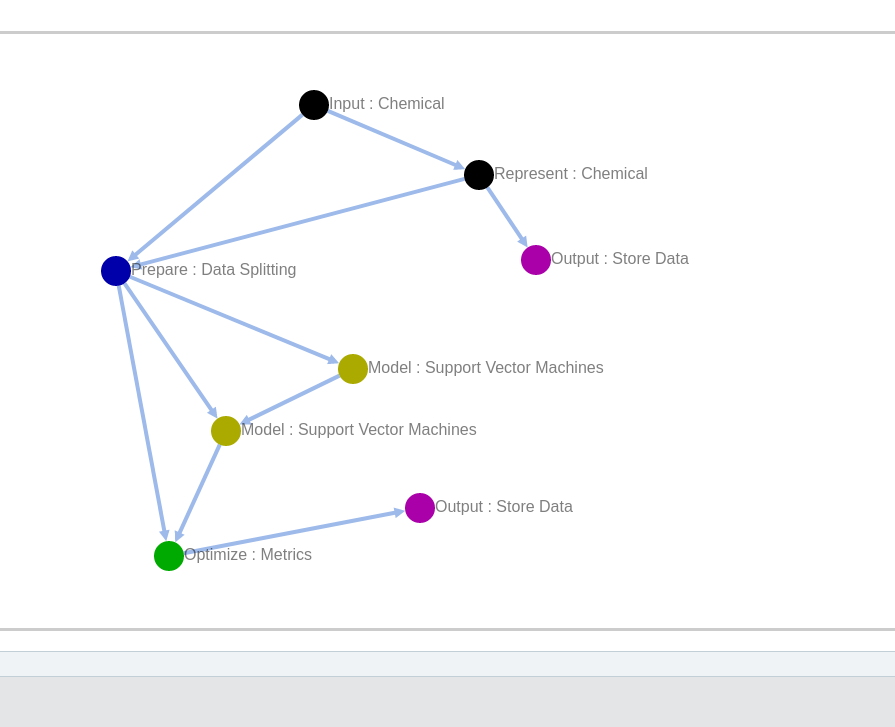
(b) A template for predicting polarizability from 3D Coulomb Descriptors
Building a Graph from Scratch
Right clicking a blank canvas area gives an options to add a new node. The different types of nodes are organized by a broader task heading that is relevant to data processing pipelines. They are:
- Input: CSV, Chemical
- Represent: Dimensionality Reduction, Chemical
- Prepare: Preprocessing, Data Splitting
- Model: Linear, Neural Network, Support Vector Machines
- Optimize: Selection, Metrics
- Output: Store Plot, Store Data
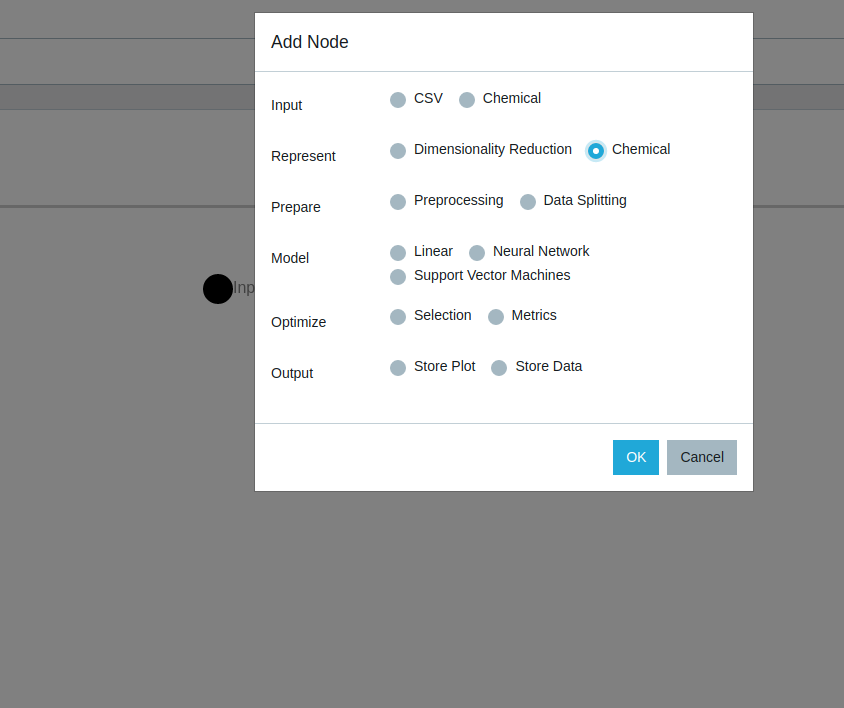
(a) Menu for selecting node type according to dataflow task
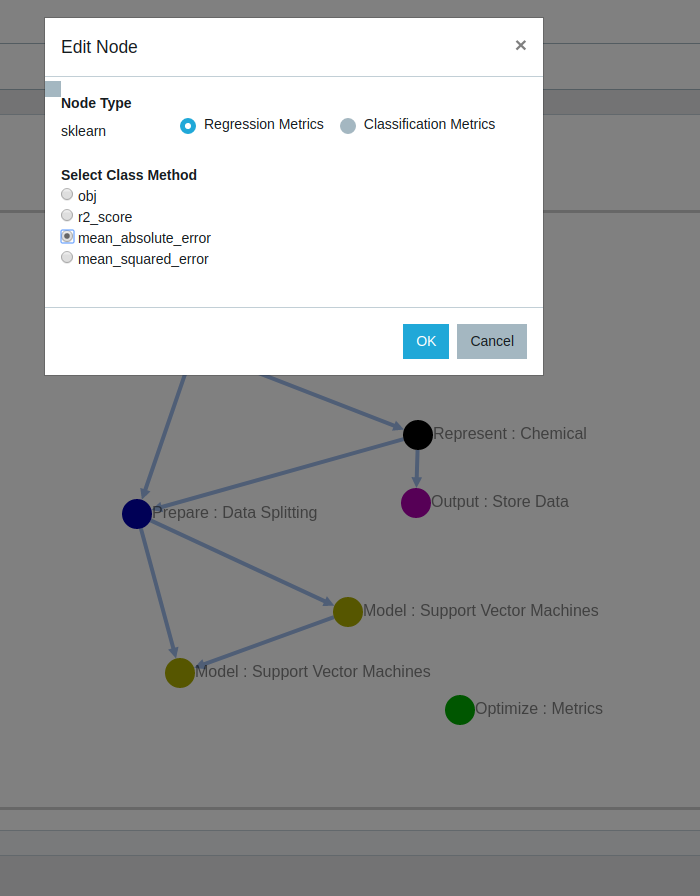
(b) Configuring Node properties by selecting required method or function
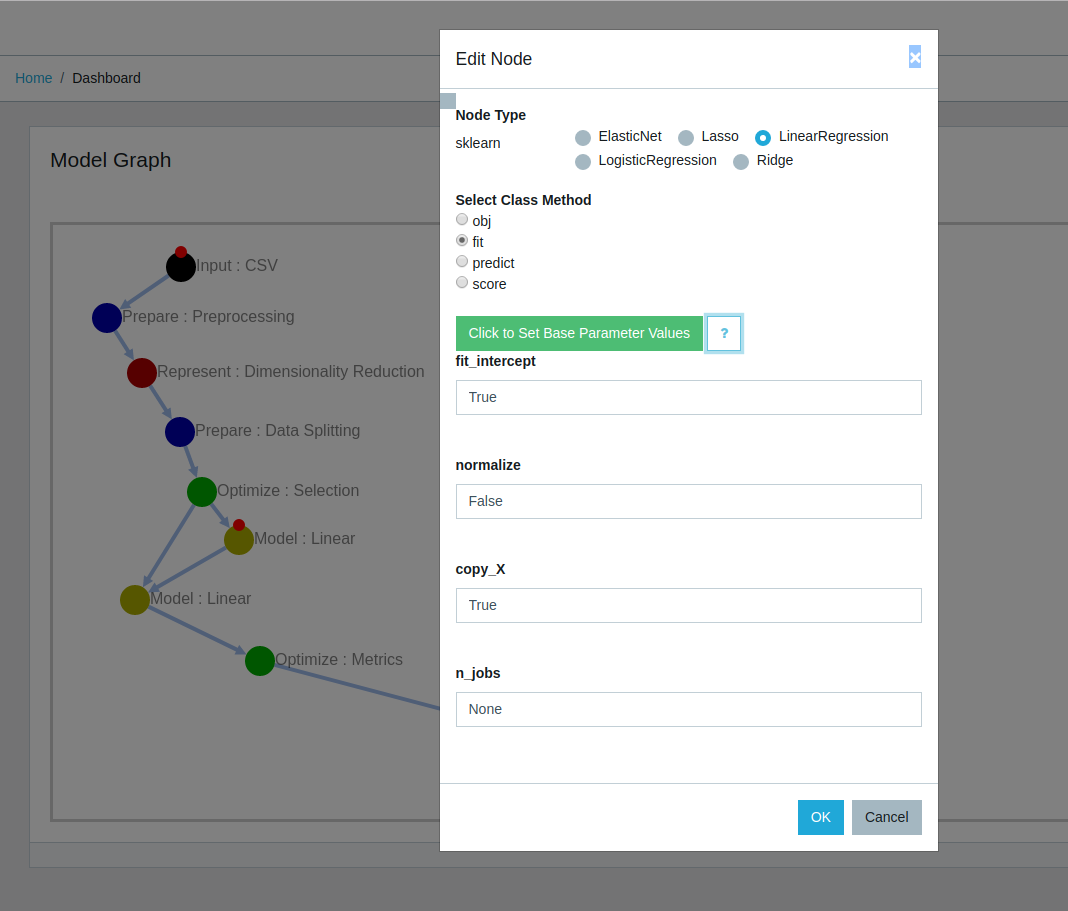
The ML toolkit provides an expansive amount of configuration options for each specific node types and methods. All options come filled with default values and a help documentation details to understand each of the parameters. Once the user selects the base node type the next steps are to configure base properties and select the specific method to run. Adding a new node directly opens the option to edit the newly added node. One might also come back in the future or if using a saved template, edit a previously created node to change some base parameters of method used. Clicking the "question mark" symbols gives detailed explanation of each parameter.
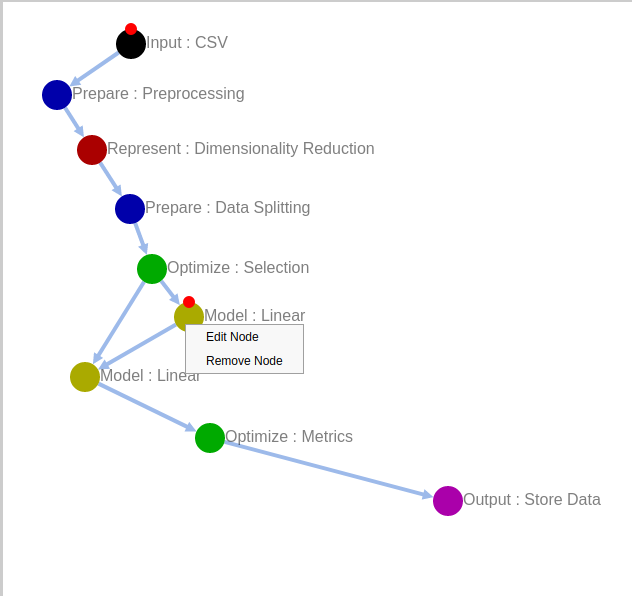
(a) Editing an existing node to change its properties
(b) All available node properties for a particular node are made available for configuration
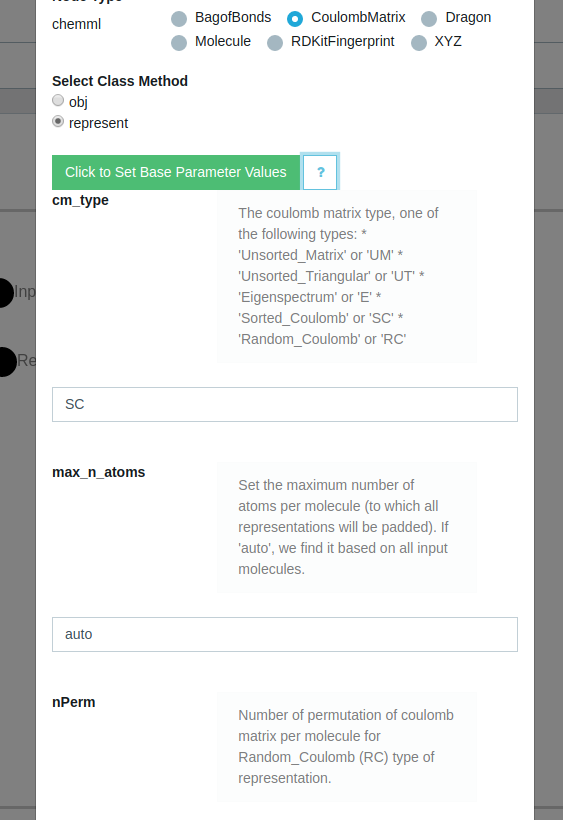
Detailed view (by clicking on "Hint" icon) explaining each node and function property
Drawing and Editing Edges
To draw an edge, a user must first have a source node and a target node. Then, if the user hovers the mouse over the source node, a small red circle on the circumference can be clicked, pressed, and dragged into an arrow towards the target node. Drawing an edge gives us options to configure the edit edge menu.
Just as nodes describe each specific function being carried out the edge menus are highly important for the proper functioning. The edges between nodes dynamically define the available outputs of the source node and the expected inputs of the destination node. In short, the edge denotes the direction and nature of data flow between nodes.
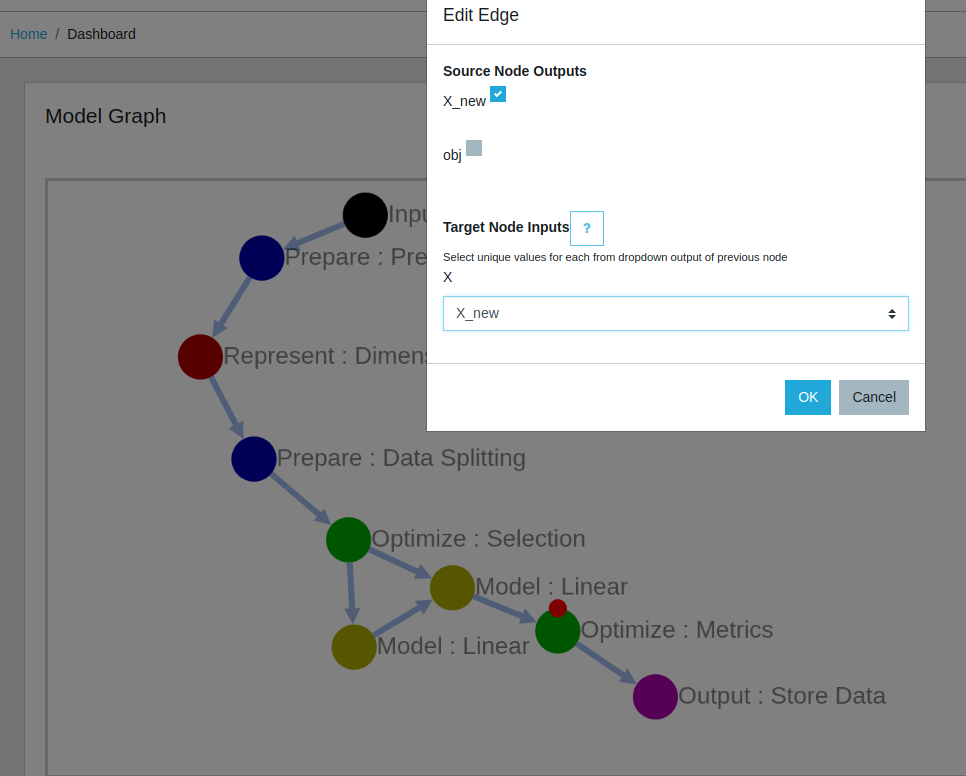
The user has to select which outputs are necessary to be passed on to the the next node in the form of a selection checkbox, where each option selected becomes available as a potential input for the following node. The input selection gives the user the facility to select from a dropdown menu of the available outputs. Thus, in cases like data splitting where there are multiple input to output mappings the user can easily chose which parameters to use. It must be noted that one edge can be used to make one input/output connection only. However, each node can support multiple outgoing and/or incoming edges allowing design of complex dataflows.
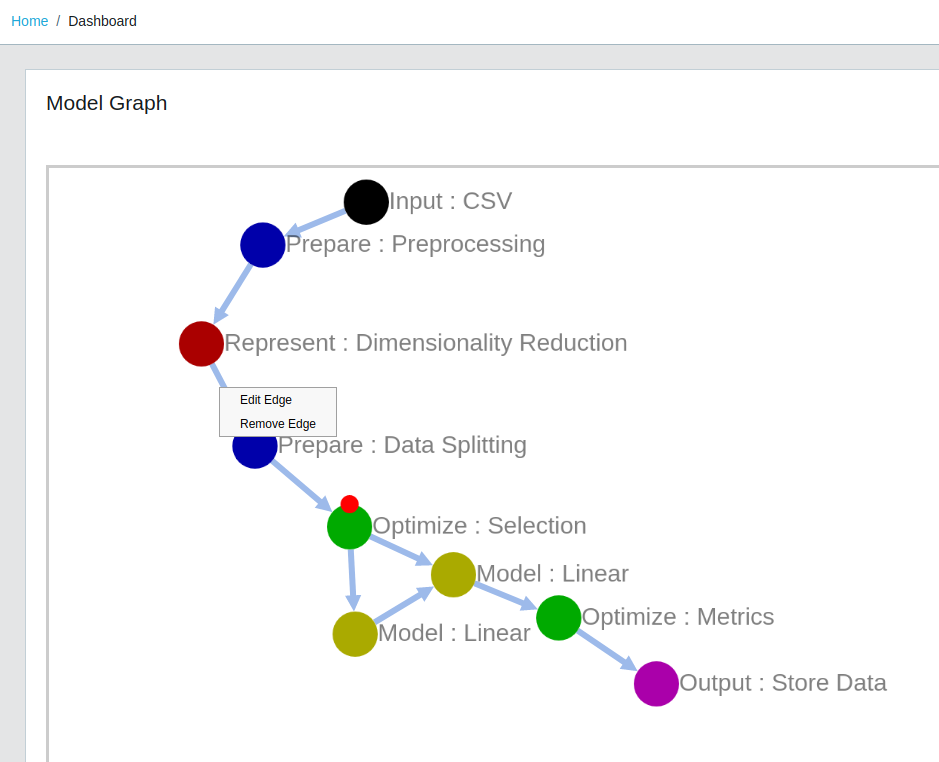
(a) Hover click and drag to draw edges. Right click on new edge to configure.
(b)Edge edit menu allowing the user to connect outputs of source node to inputs of destination node.
Graph Layouts
When creating a graph a user might position nodes randomly, and it might be hard to structure them without ending up in a complex bunch of nodes and edges for large computational graphs. Hence, we provide the options to restructure the graph layout once done with the creation part. The "Change Layout" option on the top-right of the dashboard instantly transforms your computational graph in to different view forms form the list below:
- DAG: The Directed Acyclic Graph Representation adapts the graph into a sequential model attempting to place the input nodes at the topmost and the output nodes the lowermost.
- Circle: The circle layout puts nodes in a circle
- Breadth First: The breadthfirst layout puts nodes in a hierarchy, based on a breadthfirst traversal of the graph. It is best suited to trees and forests in its default top-down mode, and it is best suited to DAGs in its circle mode.
- Grid: The grid layout puts nodes in a equally-spaced grid.
- Concentric: The concentric layout positions nodes in concentric circles, based on a metric to segregate the nodes into levels.
- CoSE: Compound Spring Embedder layout uses a physics simulation to lay out graphs. It works well with noncompound graphs and it has additional logic to support compound graphs well
- Random: The random layout puts nodes in random positions within the viewport.
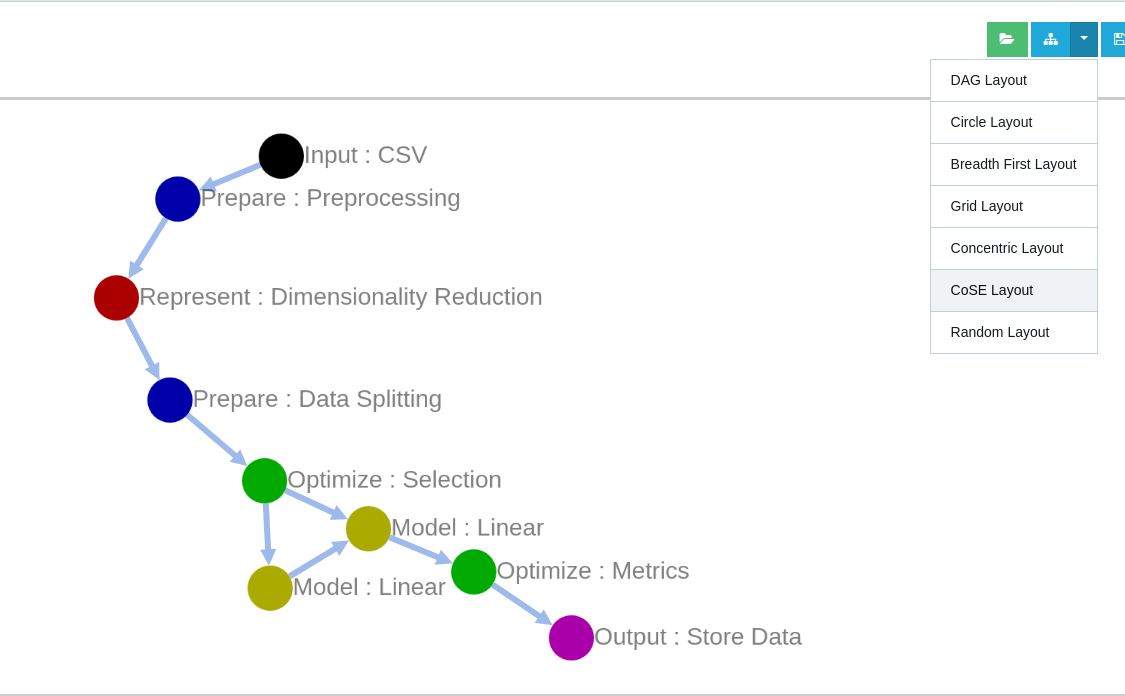
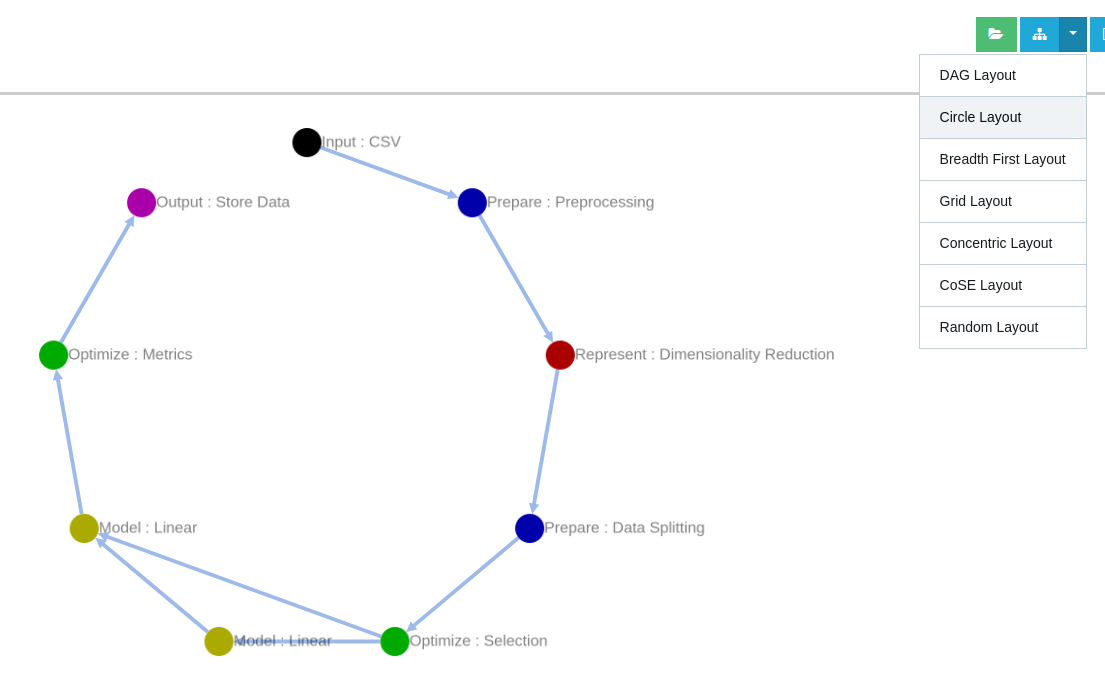
(a) Compound Spring Embedder Graph Layout.
(b) Circle Graph Layout.